Why Most Organizations Confuse Visibility with Understanding
Most organizations believe they are insight-driven.
Reports circulate regularly. Dashboards are available on demand. Numbers are present in meetings. And yet, when critical decisions are made, data often plays a surprisingly small role.
This disconnect exists because many organizations collapse three very different things—reports, dashboards, and insights—into one mental bucket. They treat them as interchangeable artifacts rather than distinct stages in the decision process.
Until this distinction is clear at the leadership level, business intelligence investments will continue to produce activity without proportionate impact. This is precisely where well-structured business intelligence services and experienced business intelligence consulting services help organizations realign BI outputs with executive decision-making.
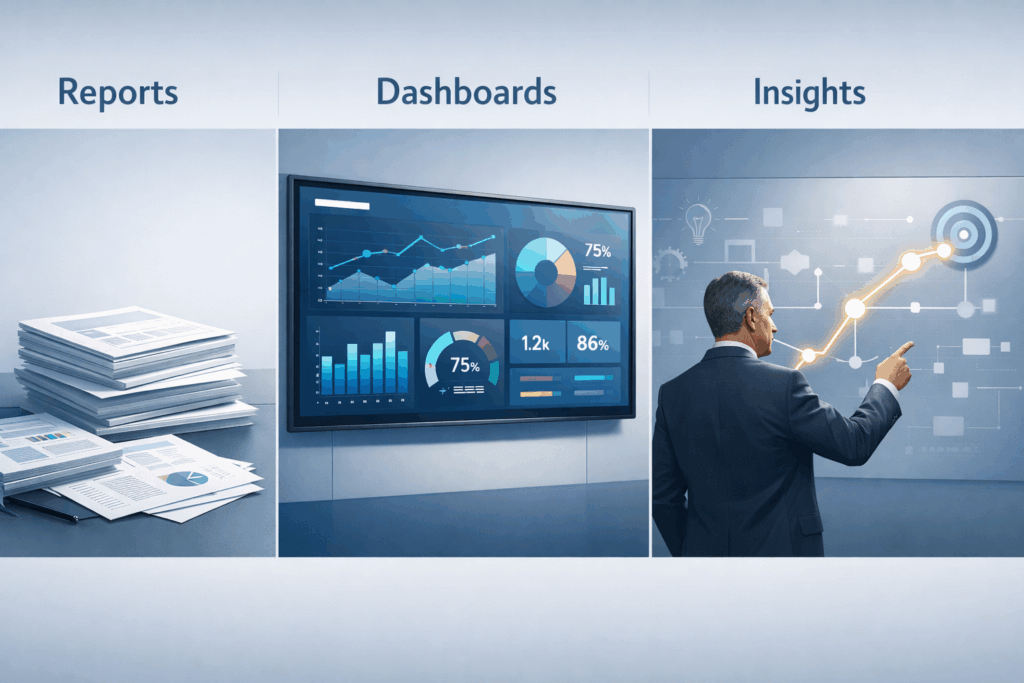
Reports: Structured Answers to Known Questions
Reports are the most familiar form of business intelligence. They are periodic, structured, and retrospective. They answer questions the organization already knows how to ask.
Financial statements, operational summaries, and compliance reports all fall into this category. Their value lies in consistency and completeness. They create a baseline understanding of what happened.
For CXOs, reports provide reassurance. They establish control. They enable governance.
But reports are not designed to provoke decisions. They summarize reality after the fact. Their role is to inform, not to influence.
Organizations that rely exclusively on reports tend to be well-documented and slow to adapt.
Explore our latest blog post, authored by Dipak Singh: From Architecture to Advantage: How Data Engineering Enables Faster, Better Decisions
Dashboards: Visibility Without Interpretation
Dashboards emerged to solve a different problem: speed.
Instead of waiting for periodic reports, leaders wanted continuous visibility into performance. Dashboards aggregate key metrics and make them accessible in near real time.
When designed well, dashboards reduce friction. They surface deviations early. They allow leaders to monitor trends without wading through detail.
However, dashboards have a fundamental limitation: they show, but they do not explain.
Most dashboards stop at observation. They display metrics but leave interpretation to the reader. In leadership settings, this often leads to debate rather than action.
Dashboards are powerful instruments—but only when paired with clear decision ownership.

Insights: Interpretation That Changes Choices
Insights are different.
An insight is not a metric, a chart, or a visual. It is an interpretation that connects data to a decision.
An insight explains why something happened, why it matters, and what should be considered next. It reduces ambiguity. It narrows options. It invites action.
Insights are scarce because they require judgment, context, and accountability. They cannot be automated easily.
They demand that someone stand behind an interpretation.
This is why organizations often have many dashboards and very few insights. Strong business intelligence services focus not just on building artifacts but on embedding interpretation into executive workflows.
Why This Distinction Matters at the Leadership Level
When reports, dashboards, and insights are treated as the same thing, expectations become misaligned.
Leaders expect dashboards to deliver insight. Analysts expect reports to drive decisions. BI teams are asked to “add more intelligence” without clarity on what that means.
The result is frustration on all sides.
Understanding the distinction allows leadership teams to ask better questions:
- Are we looking for assurance or direction?
- Do we need visibility or interpretation?
- Are we reviewing information or making a decision?
Without this clarity, BI remains performative rather than transformative.

How Confusion Shows Up in Practice
In organizations where these concepts are blurred, a few patterns repeat.
Dashboards multiply without reducing meeting time. Reports grow longer without improving confidence. Insights are requested reactively, often under time pressure, and rarely reused.
Over time, leaders learn to skim data rather than engage with it. Decisions revert to experience and instinct, with data playing a supporting role at best.
This is not a failure of analytics capability. It is a failure of framing.
The Role Each Artifact Should Play
A useful way for CXOs to think about BI is as a layered system.
Reports provide assurance. Dashboards provide visibility. Insights provide direction.
Each layer builds on the previous one, but none can substitute for the next. Dashboards do not replace insights. Reports do not become insights by being visualized.
When organizations respect these roles, BI becomes far more effective with fewer artifacts.
Why Organizations Overinvest in Dashboards
Dashboards are attractive because they feel objective and scalable. Once built, they can be shared widely. They appear neutral and non-confrontational.
Insights, by contrast, require interpretation and ownership. They invite disagreement. They force prioritization.
As a result, organizations often invest heavily in dashboards and underinvest in insight creation. Visibility increases, but decisiveness does not.
This imbalance is one of the most common reasons BI fails to influence outcomes. Strategic business intelligence consulting services help leadership teams correct this imbalance by aligning BI outputs directly with strategic decisions.
A Subtle Shift That Changes Everything
One of the most effective shifts leadership teams make is to stop asking:
“Do we have the right dashboards?”
and start asking:
“What decisions are we expecting this information to influence?”
That single question changes how BI teams design artifacts, how meetings are run, and how accountability is assigned.
Dashboards become simpler. Reports become shorter. Insights become clearer.
The Core Takeaway
For CXOs, the essential insight is this:
- Reports document reality.
- Dashboards expose patterns.
- Insights change decisions.
Confusing these leads to overproduction and underuse. Distinguishing them creates focus and leverage.
Organizations that understand this do not need more BI. They need better use of the BI they already have.
Get in touch with Dipak Singh
Frequently Asked Questions
1. What is the main difference between dashboards and insights?
Dashboards display metrics and trends, while insights interpret those metrics to recommend or influence a decision. Dashboards show what is happening; insights explain why it matters and what to consider next.
2. Why do organizations struggle to generate actionable insights?
Because insight requires interpretation, context, and ownership. Many organizations invest in tools and visualization but underinvest in analytical thinking and decision alignment.
3. Are dashboards necessary if we already have reports?
Yes. Reports provide structured historical documentation, while dashboards offer real-time visibility. However, neither replaces insight.
4. How can leadership teams improve BI effectiveness?
By clearly defining which decisions BI should support and structuring reports, dashboards, and insights accordingly. Decision-first thinking improves BI impact significantly.
5. When should a company consider business intelligence consulting services?
When dashboards are abundant but decisions remain instinct-driven, or when BI investments are not translating into measurable strategic outcomes. Experienced business intelligence consulting services can help align data assets with executive priorities and embed insight into leadership workflows.